Step 3: Operate
Welcome to the third and final step, Application Developer!
In this step, you will learn how to operate your application on Elastisys Compliant Kubernetes.
Configure Dashboards and Alerts
Monitor your Application
To monitor your application, you will log in to your Grafana. Recall how to log in to your web portals from Step 1: Prepare.
Grafana visually displays the monitoring data that Prometheus has collected on your behalf. A significant amount of metrics are already collected for you, out of the box, on Elastisys Compliant Kubernetes. This means you can visualize data about the cluster immediately.
But Prometheus can also be instructed to collect specific metrics from your own application. Perhaps this is more useful to you than monitoring metrics that relate to cluster health (in particular if somebody else managed Elastisys Compliant Kubernetes for you).
To instruct Prometheus on how to do this, you create a ServiceMonitor. This is a Kubernetes resource that configures Prometheus and specifies how to collect metrics from a particular application.
The user demo already includes a ServiceMonitor, as required for Compliant Kubernetes to collect metrics from its /metrics endpoint:
{{- if .Values.serviceMonitor.enabled -}}
apiVersion: monitoring.coreos.com/v1
kind: ServiceMonitor
metadata:
  name: {{ include "ck8s-user-demo.fullname" . }}
  labels:
    {{- include "ck8s-user-demo.labels" . | nindent 4 }}
spec:
  selector:
    matchLabels:
    {{- include "ck8s-user-demo.selectorLabels" . | nindent 6 }}
  endpoints:
  - port: http
{{- end }}
The screenshot below shows Grafana in "Explore" mode (the compass icon to the left) featuring the query rate(http_request_duration_seconds_count[1m]). It shows the request rate for the user demo application for each path and status code. As can be seen in the graph, the /users endpoint is getting more traffic than the other endpoints.
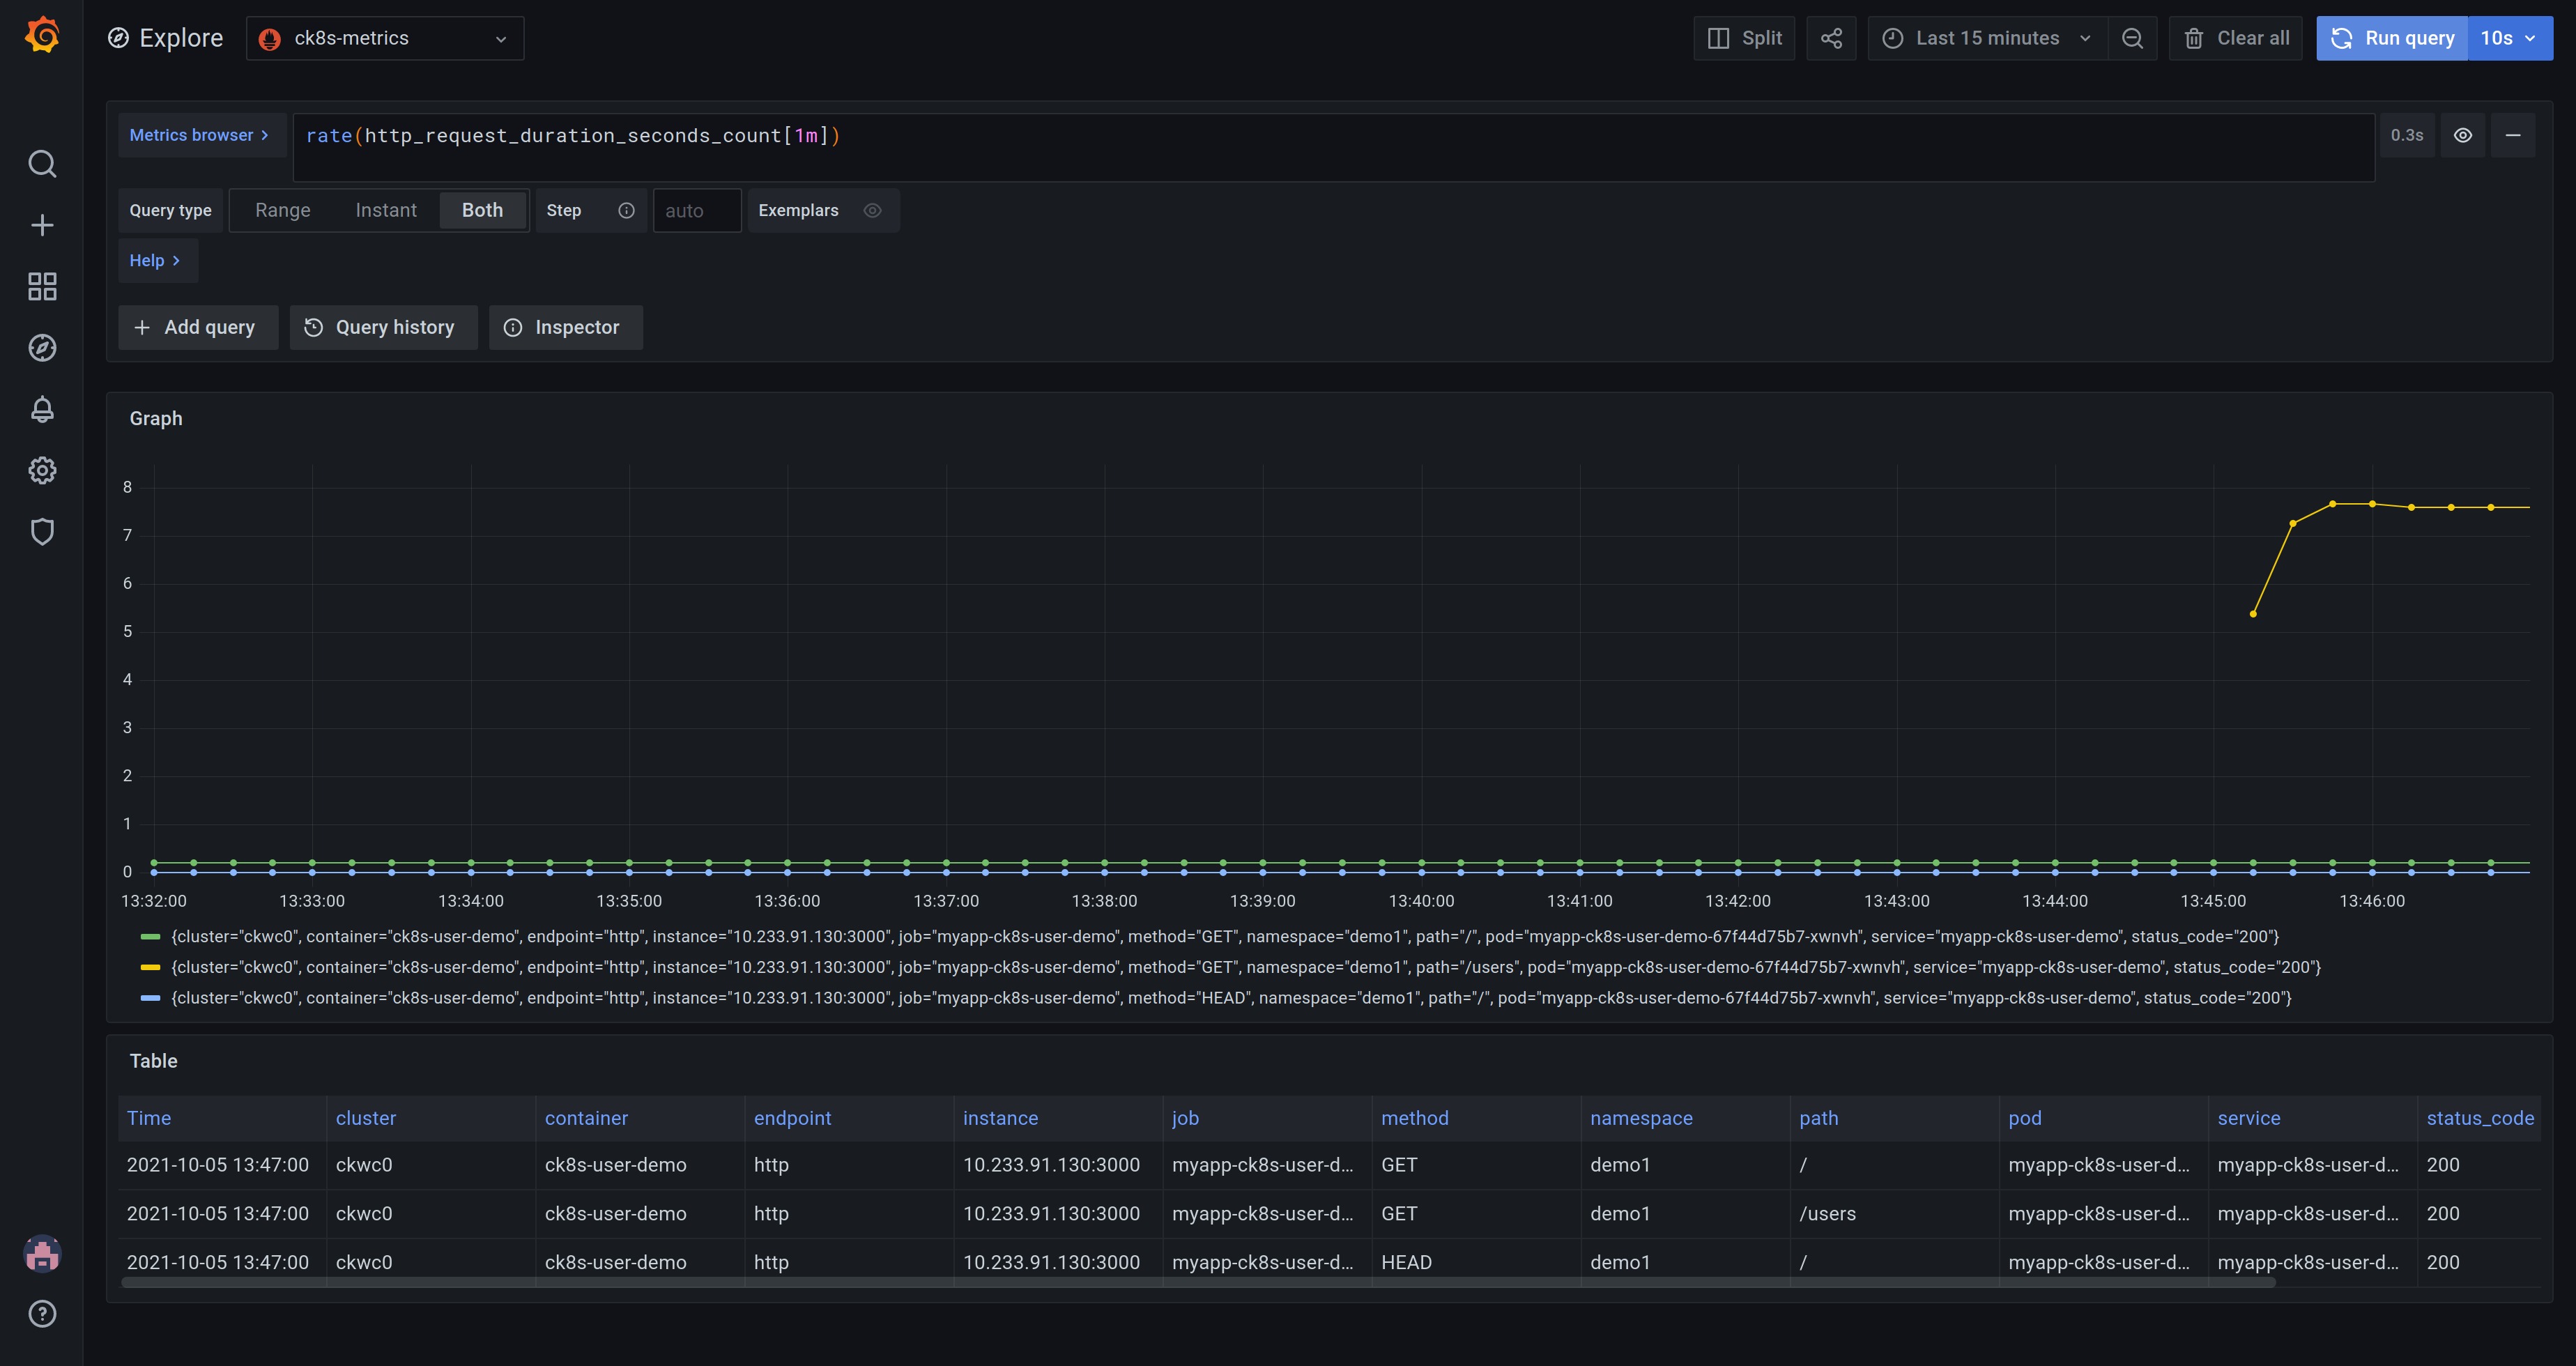
The "Explore" mode is great for developing queries and exploring the data set. If you want to save a query so you can refer back to it, you can create a Dashboard instead. Dashboards consist of multiple Panels, each of which, can display the results of running queries. Learn more about Grafana panels.
Note
You may want to save frequently used Dashboards. Compliant Kubernetes saves and backs these up for you.
Go deeper into metrics.
Alert on Application Metrics
Visualizing monitoring metrics is one thing. Sometimes, you may need to act on what they show, immediately. For that reason, the Prometheus monitoring system includes Alertmanager.
- Prometheus is responsible for maintaining a set of Rules, which express trigger conditions via expressions. Once a rule has triggered, it has entered an alerting state.
- Alertmanager is responsible for forwarding information about any rules in the alerting state to your chosen destination, which could be your company's Slack or similar. A number of integrations are available.
If you wish to create rules based on application-specific monitoring metrics, you must first create appropriate ServiceMonitors as described above.
The user demo already includes a PrometheusRule, to configure an alert:
{{- if .Values.prometheusRule.enabled -}}
apiVersion: monitoring.coreos.com/v1
kind: PrometheusRule
metadata:
  name: {{ include "ck8s-user-demo.fullname" . }}
  labels:
    {{- include "ck8s-user-demo.labels" . | nindent 4 }}
spec:
  groups:
  - name: ./example.rules
    rules:
    - alert: ApplicationIsActuallyUsed
      expr: rate(http_request_duration_seconds_count[1m])>1
{{- end }}
The screenshot below gives an example of the application alert, as seen in Alertmanager.
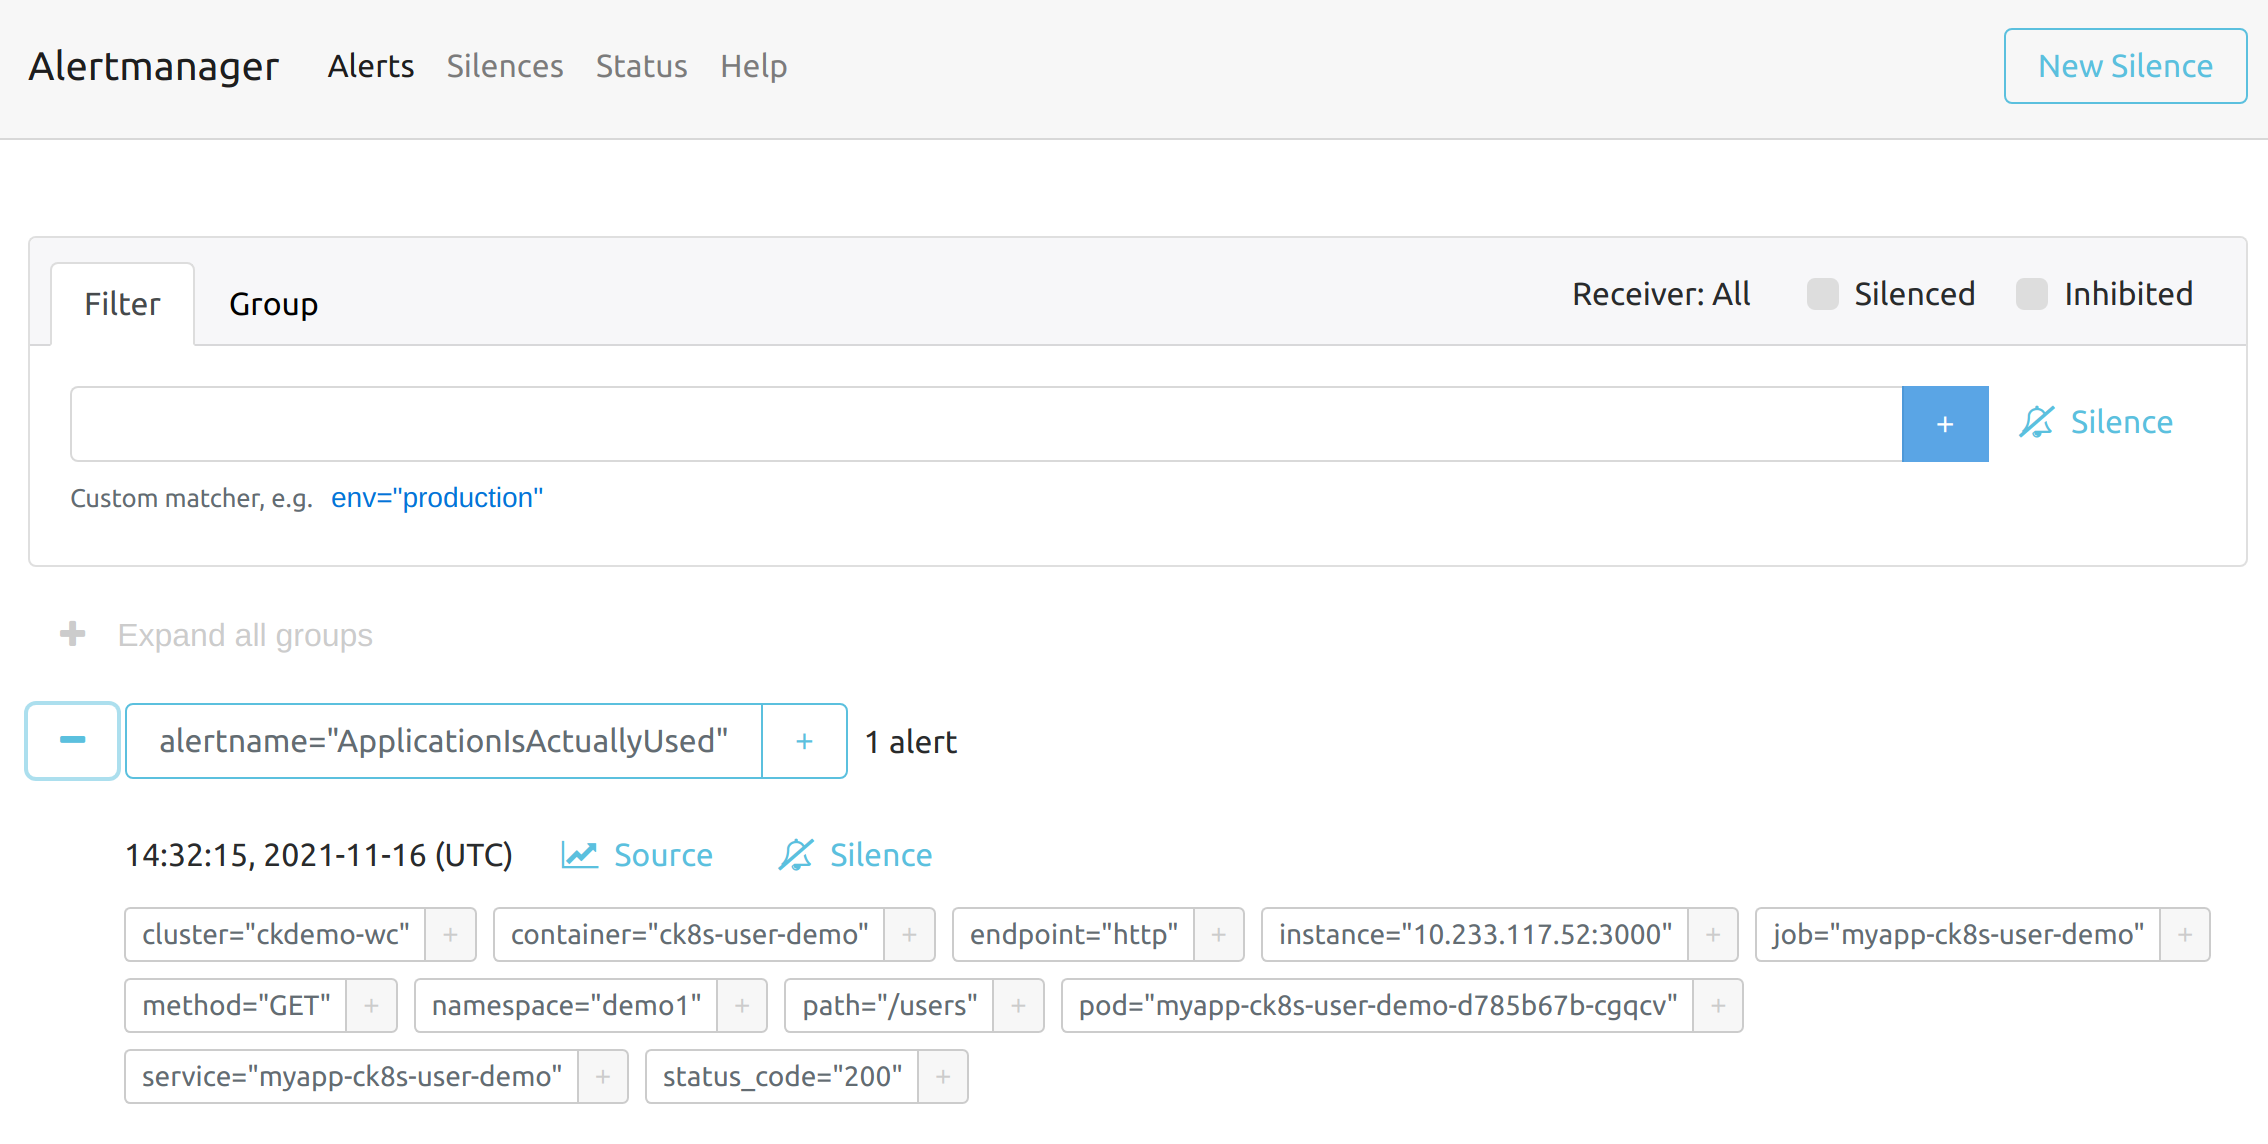
Go deeper into metric alerts.
Alert on Log Contents
Similar to alerting based on monitoring metrics, you may need to alert based on application log contents. For instance, it might make sense to send any log line of the FATAL log level to your Slack channel for immediate attention.
The process of setting up log-based alerts is highly graphical, and supported by your OpenSearch Dashboards that is part of Elastisys Compliant Kubernetes. Recall how to log in to your web portals from Step 1: Prepare.
Go deeper into log-based alerts.
Test Backups and Capacity Management
Disaster recovery is about so much more than backing up and restoring data. Backing up data is a necessary, but not sufficient, part of that.
Not having sufficient capacity is also a kind of disaster, albeit, one that is easy to mitigate.
Back up Application Data
Compliant Kubernetes takes a daily backup of all Kubernetes Resources in all user namespaces. Persistent Volumes will be backed up if they are tied to a Pod. If backups are not wanted the label compliantkubernetes.io/nobackup can be added to opt-out of the daily backups.
Application metrics (Grafana) and application log (OpenSearch) dashboards are also backed up by default.
By default, backups are stored for 720 hours (30 days).
Restoring from a backup with Velero is meant to be a type of disaster recovery. Velero will not overwrite existing Resources when restoring. As such, if you want to restore the state of a Resource that is still running, the Resource must be deleted first.
To restore a backup on demand, contact your Compliant Kubernetes administrator.
Go deeper into backups.
Capacity Management
Capacity management is about having sufficient capacity for your needs, be they in terms of storage or computational power.
Your Elastisys Compliant Kubernetes administrator should perform capacity management of the platform, to ensure that there is a sufficient amount of spare capacity on a cluster level.
As an Application Developer, you should perform capacity management on a Pod level. This primarily means setting resource requests correctly for containers inside Pods, making use of multiple instances in your Deployments and Stateful Sets (possibly via horizontal Pod autoscaling). The use of resource requests and limits is enforced via an Elastisys Compliant Kubernetes safeguard.
Automate with CI/CD
Elastisys Compliant Kubernetes comes with Argo CD as an Additional Service.
Compliant Kubernetes can also be integrated with an external CI/CD, such as GitHub Actions.
Next step? Going deeper!
By now, you're fully up and running! You have an application, updating it is a breeze, and you can monitor it and look at its logs. The next step is to open the "Go Deeper" section of this documentation and read up on more topics that interest you.
Thank you for starting your journey beyond the clouds with Elastisys Compliant Kubernetes!